
Crop Monitor for AMIS
Report Information
No. 142: Published September 3rd 2026
Conditions as of August 28th
To access all reports, please visit the Archive.
Please visit the Referencing Guidelines page for information on how to cite the Crop Monitor reports and products.
Overview
At the end of August, overall conditions are positive for wheat, rice, and soybeans, while mixed for maize. For wheat in the Northern Hemisphere, harvesting of winter wheat wraps up, while continuing for spring wheat. For maize, conditions are mixed across Europe, southern India, Southeast Asia, and the United States. For rice, conditions are generally favourable, though it is dry in parts of India and Thailand. For soybeans, conditions are generally favourable, but hot, dry weather is a concern across Europe and parts of the US.
Global crop condition map synthesizing information for all four AMIS crops as of August 28th. Crop conditions over the main growing areas for wheat, maize, rice, and soybean are based on a combination of national and regional crop analyst inputs and earth observation data. Crops under non-favourable conditions are displayed on the map using their crop symbols.
Crop Conditions at a Glance
Wheat – In the Northern Hemisphere, winter wheat harvesting is wrapping up under mixed conditions as spring wheat harvesting ramps up. In the Southern Hemisphere, conditions are generally favourable.
Maize – Conditions are mixed across Europe, southern India, Southeast Asia, and the United States.
Rice – Dry weather remains a concern in southern India and Thailand, while heavy rain has impacted the Philippines.
Soybeans – In the Northern Hemisphere, hot, dry weather is a concern across Europe and parts of the US.
Forecasts at a Glance
Climate Influences – El Niño conditions are present. This will most likely be a very strong event (~ 90% chance from September 2026 to January 2027), ranking as one of the strongest since 1950. El Niño conditions are forecast through May 2027 (82% chance).
Australia - The September-November forecast indicates likely above-average rainfall over Western Australia, while below-average rainfall over southwest Western Australia, south-eastern Australia, Tasmania, and parts of eastern and northern Queensland.
South Africa - The September-November forecast indicates above-average precipitation over the interior regions, while below-average over the main winter wheat-producing province of Western Cape/Wes-Kaap.
United States – he September forecast indicates likely above-average temperatures across most of the country along with above-average precipitation in the western US and New England, while below-average precipitation over parts of the central and southern Great Plains.
Wheat Conditions
Wheat crop conditions over the main growing areas are based on national and regional crop analyst inputs and earth observation data. Crop condition information is based on information as of August 28th. Where crops are in conditions other than favourable, the climatic drivers responsible for those conditions are displayed. Crop Season Specific Maps can be found in Appendix 2.
In the EU, harvesting is finishing, with above-average yields in Bulgaria and Romania offset by below-average yields in parts of western and central Europe. In Türkiye, the winter wheat harvest is wrapping up with exceptional yields. In Ukraine, harvesting is finishing with exceptional yields. In the Russian Federation, winter wheat harvesting is concluding with above-average yields in the south. Spring wheat harvesting is beginning under favourable conditions, with a smaller total sown area than last year. In Kazakhstan, spring wheat harvesting is just beginning under favourable conditions. In China, spring wheat harvesting is underway. In the US, the winter wheat harvest is wrapping up. Spring wheat harvesting is progressing with above-average yields. In Canada, winter wheat harvesting is progressing, and the spring wheat harvest is just beginning, with above-average yields expected in Alberta. In Australia, conditions are exceptional in South Australia and Victoria; however, dryness has reduced prospects in Queensland. In Argentina, conditions are favourable, with earlier areas of excess moisture receding.
For detailed description of the pie chart please see box at the bottom of the page.
Maize Conditions
Maize crop conditions over the main growing areas are based on national and regional crop analyst inputs and earth observation data. Crop condition information is based on information as of August 28th. Where crops are in conditions other than favourable, the climatic drivers responsible for those conditions are displayed. Crop Season Specific Maps can be found in Appendix 2.
In Brazil, harvesting of the summer-planted crop (larger season) is progressing, with yields above average in the North and Center-West regions. In the US, a mix of hot, dry weather in the western Corn Belt and heavy rainfall in the eastern Corn Belt threatens yields. In Canada, conditions are favourable, with good development. In Mexico, conditions are favourable for the spring-summer crop (larger season). In China, harvesting is beginning for the spring-maize crop (larger season), while the summer-maize crop (smaller season) may have been negatively affected by earlier high temperatures. In India, sowing of the Kharif crop (larger season) is wrapping up, with a reduction in total sown area compared to last year, most noticeably in Karnataka state. In Indonesia, dry-season crop harvesting continues with good yields, though total sown area is slightly lower than last year. In the EU, persistent heat and drought have substantially worsened crop conditions across western and most of central Europe. In Ukraine, hot, dry weather has caused damage and the premature drying of crops across the country. In the Russian Federation, conditions range from favourable to exceptional.
For detailed description of the pie chart please see box at the bottom of the page.
Rice Conditions
Rice crop conditions over the main growing areas are based on national and regional crop analyst inputs and earth observation data. Crop condition information is based on information as of August 28th. Where crops are in conditions other than favourable, the climatic drivers responsible for those conditions are displayed. Crop Season Specific Maps can be found in Appendix 2.
In China, conditions are favourable for both single-season rice (largest season) and late double-crop rice (medium season). In India, Kharif sowing is wrapping up in the northern and central states and is in the final stages in the eastern and southern states, with a marginal reduction in total sown area compared to last year. In Bangladesh, harvesting of the Aus crop (smallest season) is wrapping up with some damage from earlier floods. Transplanting continues for the Aman crop (medium season). In Indonesia, sowing of dry-season rice is finishing as harvesting of earlier-sown crops continues. In Viet Nam, summer-autumn rice (wet-season rice) in the north is developing, while the main-season rice (seasonal rice) crop is being sown. In the south, summer-autumn rice (wet-season rice) is being harvested as autumn-winter rice and seasonal rice develop. In Thailand, wet-season rice is experiencing mixed conditions due to drought and an outbreak of rice blast disease that has affected rice growth and development. In the Philippines, heavy rains and strong winds from an enhanced southwest monsoon and tropical cyclones in early August have damaged wet-season rice crops. In Japan, conditions are favourable.
For detailed description of the pie chart please see box at the bottom of the page.
Soybean Conditions
Soybean crop conditions over the main growing areas are based on national and regional crop analyst inputs and earth observation data. Crop condition information is based on information as of August 28th. Where crops are in conditions other than favourable, the climatic drivers responsible for those conditions are displayed. Crop Season Specific Maps can be found in Appendix 2.
In the US, conditions remain generally favourable, though hot, dry weather is negatively affecting crops in the northwestern Corn Belt. In Canada, conditions are favourable, with overall yields expected to be near average. In China, conditions are favourable, with crops in the pod-filling stage. In India, sowing is wrapping up under generally favourable conditions, with only a slight decrease in total sown area compared to last year due to early-season dry spells. In Ukraine, conditions have deteriorated due to recent heat waves and below-average precipitation, damaging crops and causing premature drying across most of the country.
For detailed description of the pie chart please see box at the bottom of the page.
Pie chart description: Each slice represents a country's share of total AMIS production (5-year average). Main producing countries (representing 95 percent of production) are shown individually, with the remaining 5 percent grouped into the “Other AMIS Countries” category. The proportion within each national slice is coloured according to the crop conditions within a specific growing area; grey indicates that the respective area is out of season. Sections within each slice are weighted by the sub-national production statistics (5-year average) of the respective country. The section within each national slice also accounts for multiple cropping seasons (i.e., spring and winter wheat). When conditions are other than’ favourable’, icons are added that provide information on the key climatic drivers affecting conditions.
Information on crop conditions in non-AMIS countries can be found in the GEOGLAM Crop Monitor for Early Warning.
Climate Influences: El Niño Watch & Positive IOD Watch
El Niño conditions are present. This will most likely be a very strong event (~ 90% chance from September 2026 to January 2027, according to the August 2026 NOAA ENSO outlook), ranking as one of the strongest since 1950. El Niño conditions are forecast through May 2027 (82% chance).
El Niño events tend to enhance rainfall in Central Asia, southern North America, south-eastern South America, southern Europe, eastern and southern East Africa, and southern and eastern China. Drier-than-average conditions tend to occur in Central America, the Caribbean, northern South America, parts of western and northern East Africa, the Sahel region, Southern Africa, India, Northern China, the Maritime Continent, and Australia.
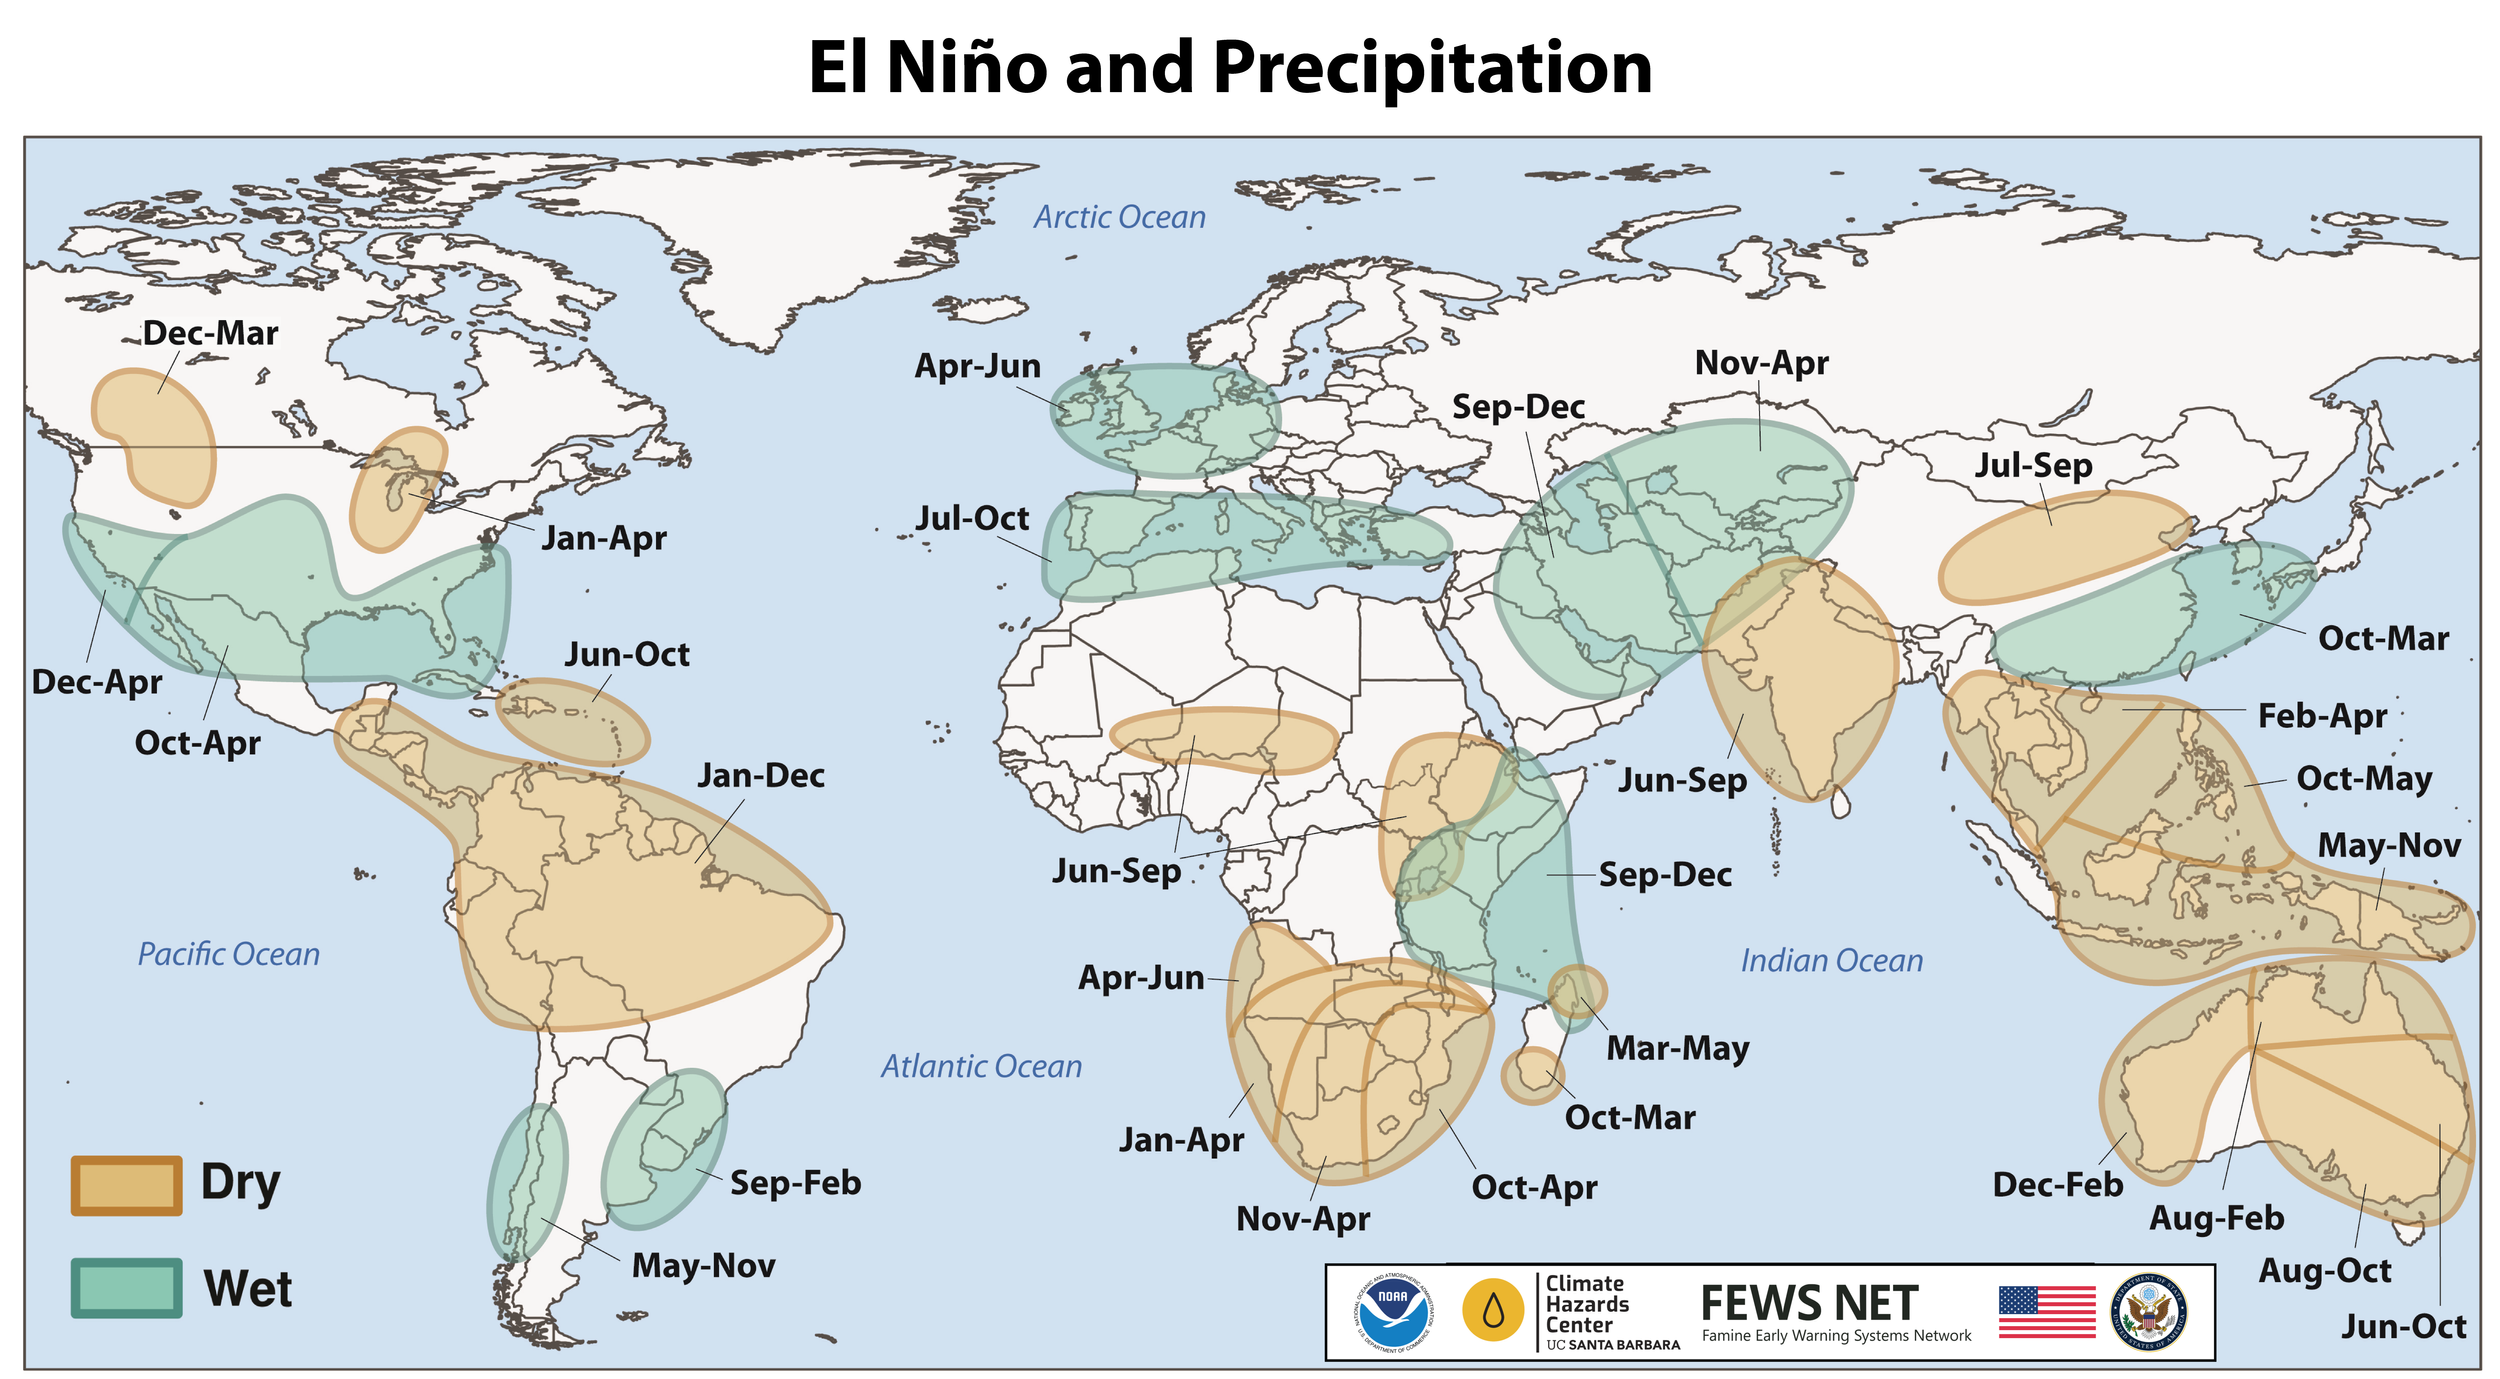
Location and timing of likely above- and below-average precipitation related to El Niño events. Based upon observed precipitation during 22 El Niño events since 1950, wet and dry correspond to a statistically significant increase in the frequency of precipitation in the upper and lower thirds of historical values, respectively. Statistical significance at the 95% level is based on the resampling of precipitation during neutral El Niño-Southern Oscillation conditions. Source: FEWS NET & NOAA & CHC
Positive Indian Ocean Dipole (IOD) conditions are forecast during September to December 2026, with a strong event possible. A positive IOD tends to enhance the drying influence of El Niño in Australia and the Maritime Continent and substantially increase the chances of a wet and intense East Africa short rains season.
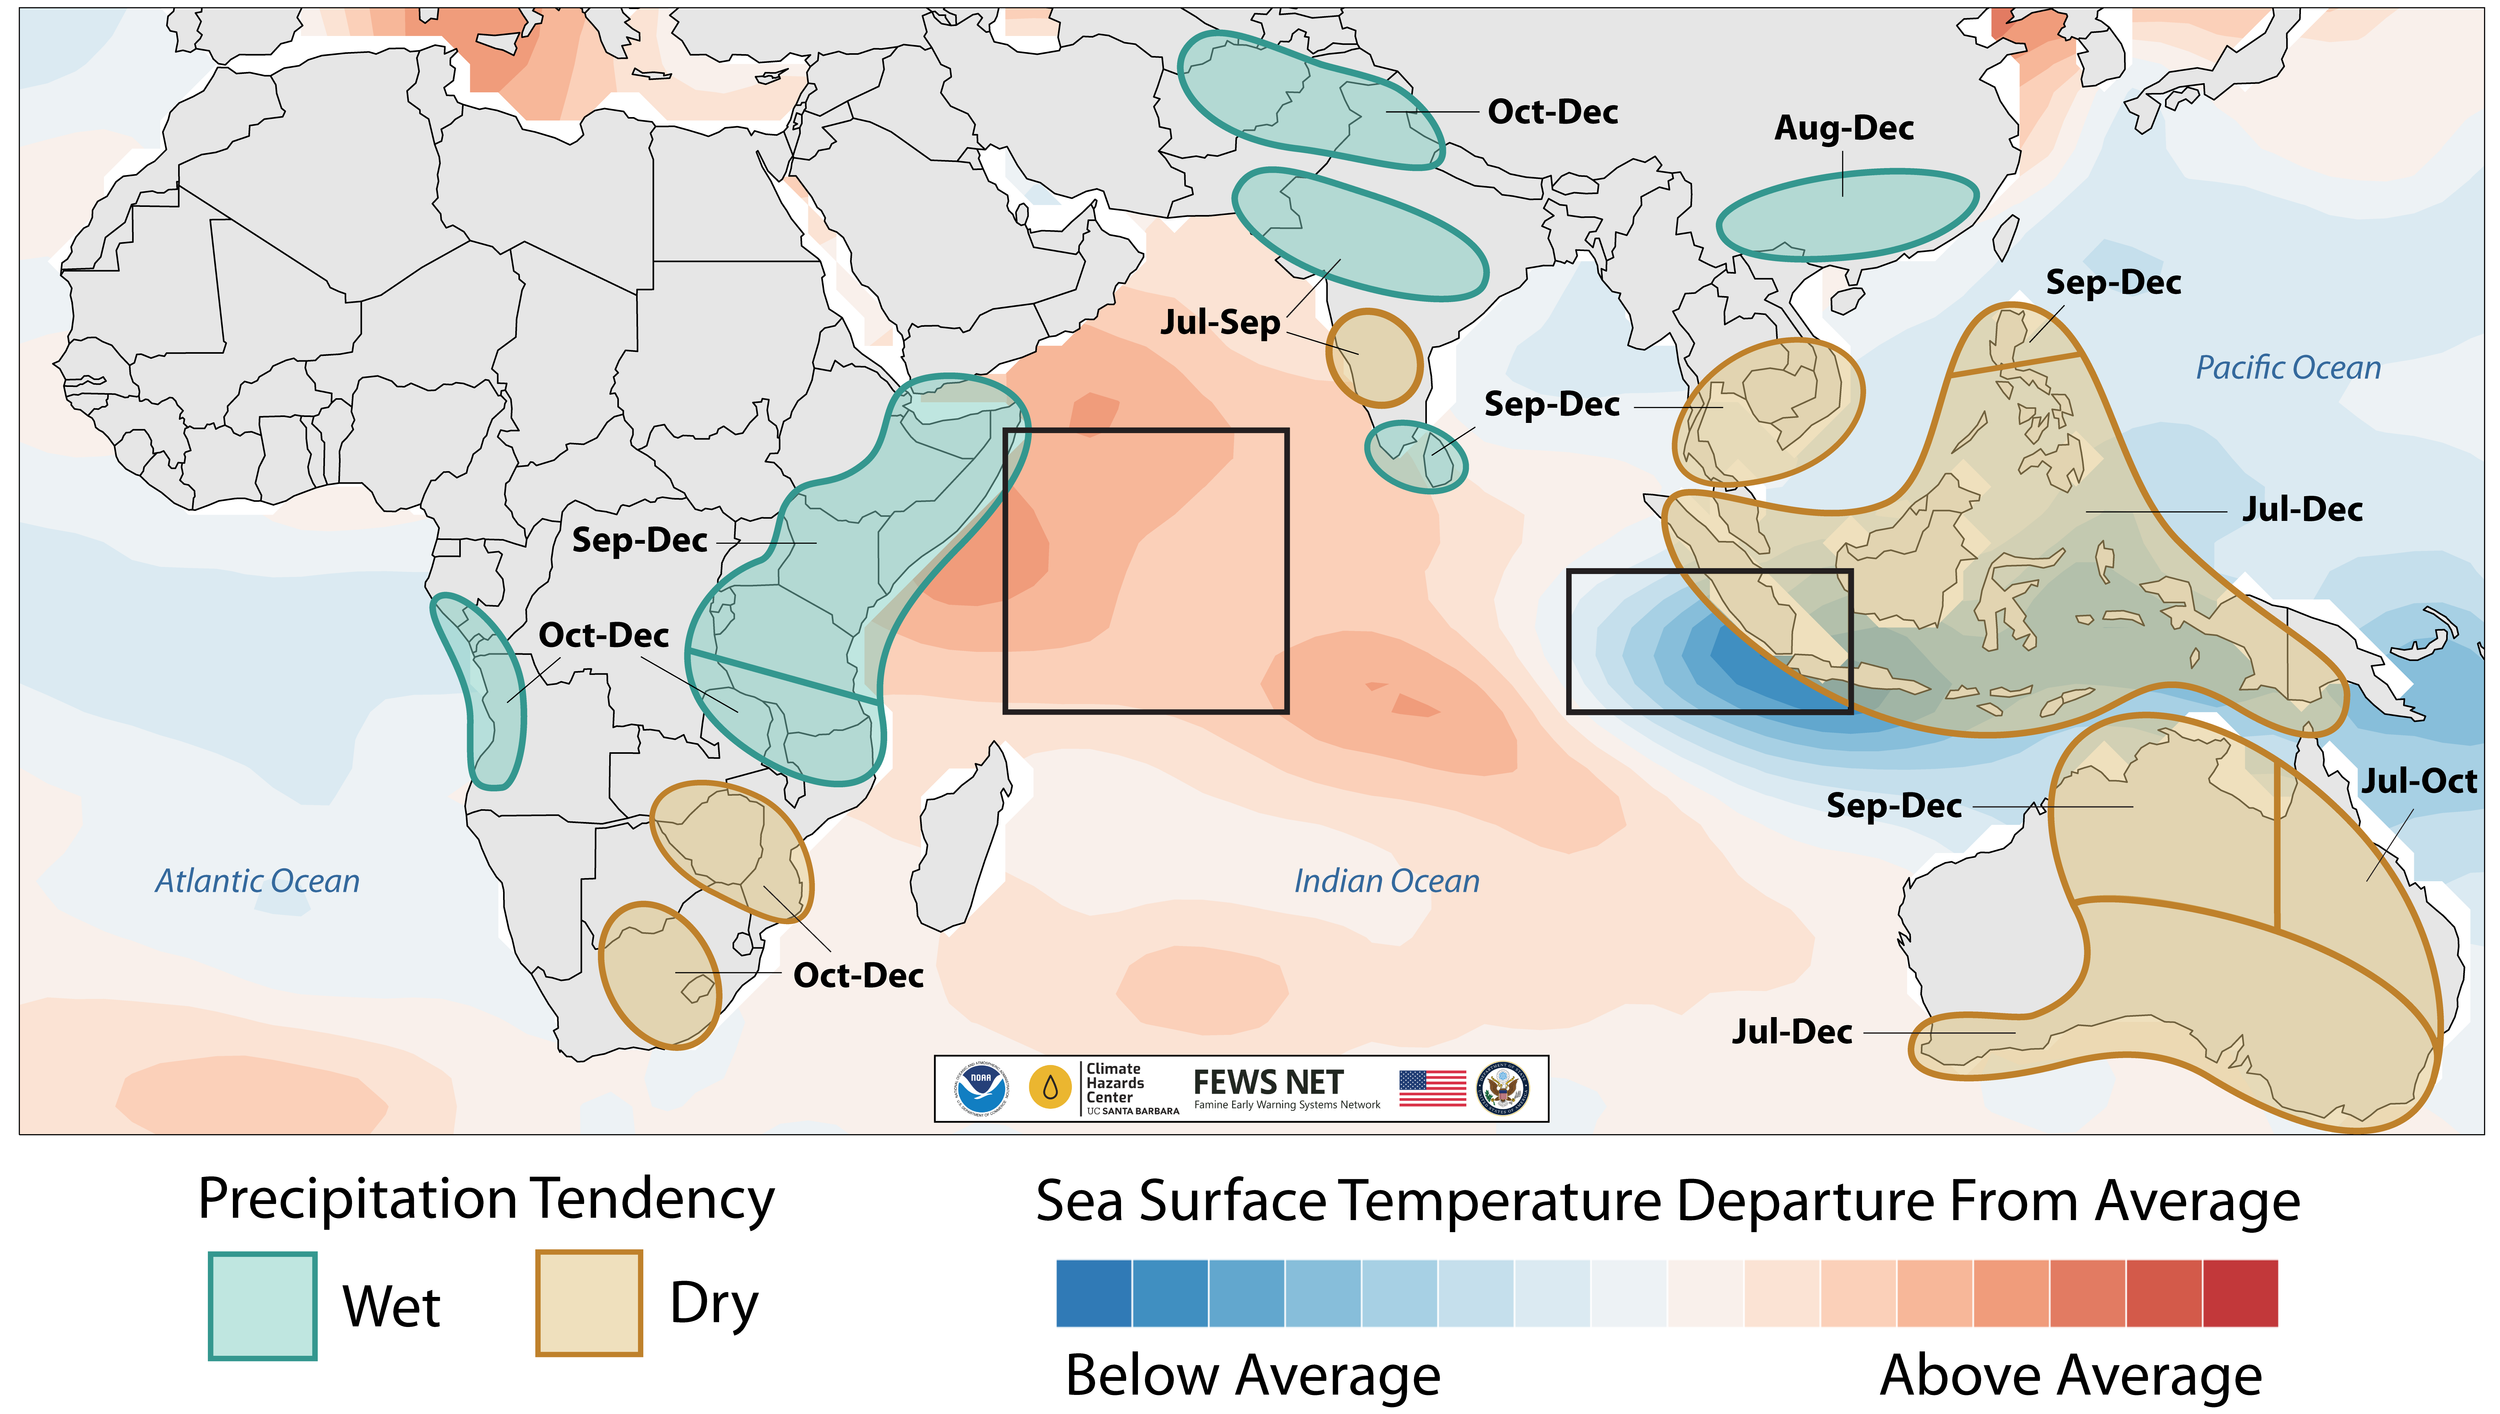
The timing of wet and dry conditions based on Climate Research Unit, CHIRPS, and Global Precipitation Climatology Centre precipitation (green and brown polygons), and sea surface temperature departures from average during July September (blue and red shading), related to the IOD. The regions used to define the Dipole Mode Index are outlined in black.
During late August through early September 2026, abnormally hot temperatures are forecast in active crop development areas of the central and southeastern United States, Mexico, Central America, the Caribbean, northeastern Paraguay, southern Europe, West Africa, the Sahel region, and East Africa, Yemen, southern and northern India, Pakistan, Central Asia, northeastern China, southern Vietnam, and the southern Philippines.
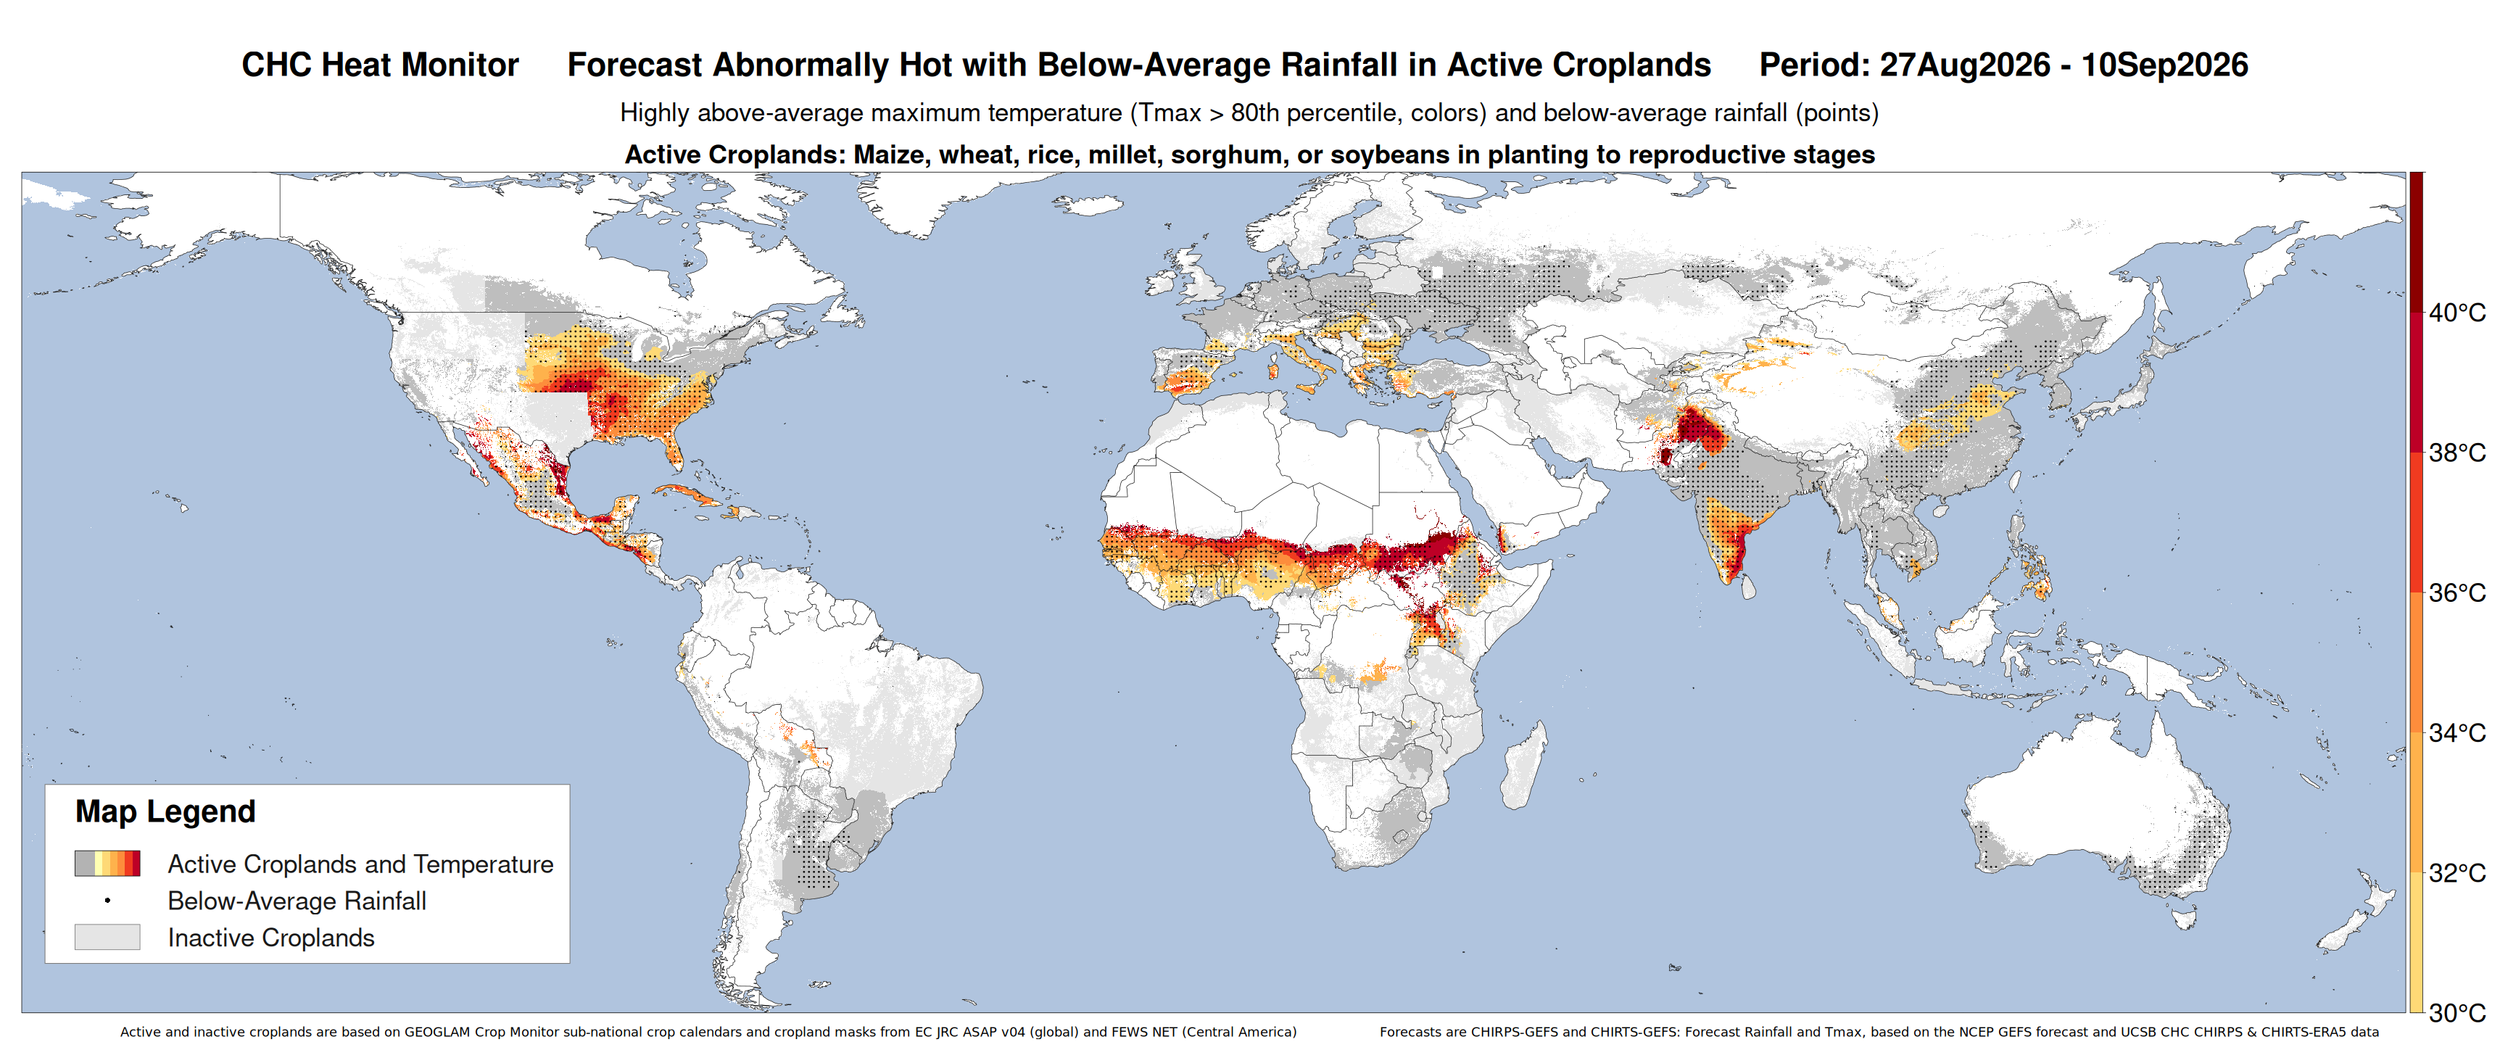
CHC AgriHeat Forecast for August 27 to September 10, 2026. Forecast 15-day average maximum temperatures are shown where they will be abnormally hot (Tmax > 80th percentile and > 30 C) and in active crop-growing areas. Areas with forecasted below-average rainfall for this period are also identified. Based on a 15-day CHIRTS-GEFS forecast from June 26, 2026. From UCSB Climate Hazards Center. Map source: UCSB Climate Hazards Center
Global Two-week Precipitation Forecast
The two-week forecast (Figure 1) shows a chance of above-average precipitation over the southwest US, northwest Mexico, central and southeast Brazil, northeastern Bolivia, Paraguay, central United Kingdom, northern Germany, northern Poland, Lithuania, Latvia, Estonia, Belarus, northwestern Ukraine, the western Russian Federation, Côte d'Ivoire, central Angola, southern Zambia, northwestern Zimbabwe, South Africa, Lesotho, northeastern Afghanistan, southwestern China, eastern Myanmar, northern and northeastern Thailand, northwestern Laos, and the Republic of Korea.
There is also a risk of below-average precipitation over western Canada, the mid-Atlantic US, southern Mexico, El Salvador, Honduras, western Nicaragua, the Dominican Republic, western Colombia, northern Ecuador, Venezuela, Guyana, Suriname, French Guiana, northern and southern Brazil, Uruguay, eastern Argentina, Portugal, Spain, southern France, southern Italy, Romania, southern Serbia, Kosovo, Albania, Montenegro, northern Greece, Türkiye, Georgia, Armenia, Azerbaijan, the southern Russian Federation, northwestern Iran, northern Algeria, northeastern Morocco, southern Mauritania, Senegal, Mali, Burkina Faso, northern Benin, southern Niger, northern Nigeria, central and southern Chad, central and southern Sudan, South Sudan, Eritrea, central and western Ethiopia, western Kenya, Uganda, Rwanda, Burundi, northern and southern Tanzania, the western Democratic Republic of the Congo, northern Mozambique, southern Yemen, eastern Kazakhstan, southern and northern India, Sri Lanka, northwestern and eastern China, southern Thailand, the southern Philippines, Malaysia, Brunei, Indonesia, Papua New Guinea, eastern Australia, and northern New Zealand.
Figure 1: IRI SubX Precipitation Biweekly Probability Forecast for 5 – 18 September 2026, issued on 28 August 2026. The forecast is based on statistically calibrated tercile category forecasts from three SubX models. Source: IRI Subseasonal Forecasts Maproom
Australia Outlook
The September-October-November outlook indicates high chances of above-average precipitation over Western Australia, western Northern Territory and western South Australia, while precipitation is likely to be below average over southeastern Western Australia, southern South Australia, Victoria, southern New South Wales, eastern and northern Queensland, northern and eastern Tasmania, and the northern tip of the Northern Territory. During the same time, minimum temperatures are likely to be above-average over most of the country, with the largest increase over Western Australia. Maximum temperatures are likely to be above-average over most of the country, except for the north, with the largest increases over southwestern Western Australia, southern South Australia, Victoria, and New South Wales.
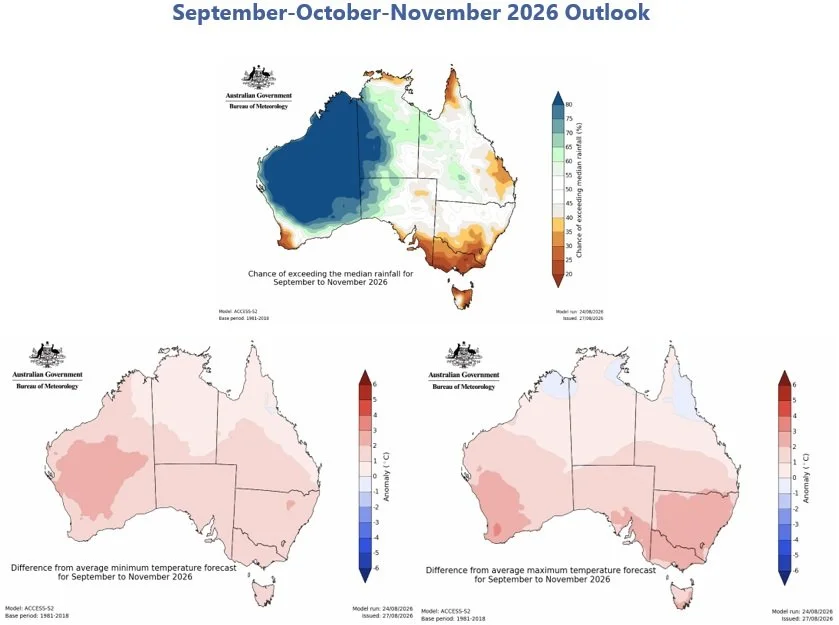
Top: September-October-November 2026 chance of exceeding the medium precipitation forecast. Bottom Left: September-October-November 2026 difference from average minimum temperature forecast. Bottom Right: September-October-November 2026 difference from average maximum temperature forecast. Maps from the Australian Bureau of Meteorology
South Africa Outlook
The September-October-November forecast indicates that above-average precipitation is likely over the northern Eastern Cape/Oos-Kaap, Free State/Vrystaat, KwaZulu-Natal, southern Mpumalanga, Northern Cape/Noord-Kaap, southern and western North West/Noordwes, and northeastern Western Cape/Wes-Kaap, while below-average precipitation is likely over southwest Eastern Cape/Oos-Kaap, northern Mpumalanga, and most of Western Cape/Wes-Kaap. During this time, both minimum and maximum temperatures are highly likely to be above-average. The weather forecast will be beneficial to winter crops in the interior and eastern coastal areas, while likely negative for winter crops in the Western Cape/Wes-Kaap.
Top: September-October-November 2026 precipitation anomaly forecast. Bottom Left: September-October-November 2026 minimum temperature anomaly forecast. Bottom Right: September-October-November 2026 maximum temperature anomaly forecast. Maps from the South African Weather Service
United States Outlook
The September 2026 precipitation forecast indicates likely above-average precipitation over central New England, southern Florida, northern Michigan, the Pacific Northwest, Interior Northwest, the Great Basin, the central Rockies, and the Southwest, while below-average precipitation is likely over eastern North Carolina, eastern Kansas, Missouri, northeastern Oklahoma, northern Arkansas, southern Illinois, western Kentucky, and western Tennessee. At the same time, temperatures are likely to be above average across most of the country except for the Pacific Northwest and New England.
Based upon September’s weather outlook, drought conditions are likely to worsen or expand over parts of Kansas, Texas, Missouri, Arkansas, and western Tennessee. At the same time, drought conditions are likely to improve or be removed over parts of Maine, Florida, southern Louisiana, southeastern Texas, western Oregon, Utah, western Colorado, Arizona, and western New Mexico.
Upper Left: September 2026 precipitation outlook issued on 31 August 2026. Upper Right: September 2026 temperature outlook issued on 31 August 2026. Bottom: September 2026 drought outlook released on 31 August 2026. Maps from NOAA CPC and NOAA/National Weather Service, National Centers for Environmental Prediction, and Climate Prediction Center