Special Report
Report Information
El Niño 2026-2027: Anticipated Climate and Agricultural Yield Impacts
Published June 16th, 2026
For access to all reports, please visit the Archive.
Please visit the Referencing Guidelines page for information on how to cite the Crop Monitor reports and products.
Highlights
El Niño conditions are now present and are likely to continue through March 2027.
The El Niño event will continue to strengthen over the coming months, likely reaching its peak intensity as a very strong (>2.0°C) event in November-January.
Stronger El Niño events lead to more predictable, though usually not more severe, crop yield outcomes.
At the global scale, past El Niño events tend to decrease rice yields the most, with yields being about 1.0 to 1.5% below trend, while soybean yields tend to increase the most, with yields being about 1.5 to 2.0% above trend.
Regionally, Central Asia, bimodal East Africa, southern South America, and the US are likely to see the most positive crop yield impacts, while Southern Africa, Central America, India, and Australia are likely to see the most negative crop yield impacts.
Current Situation
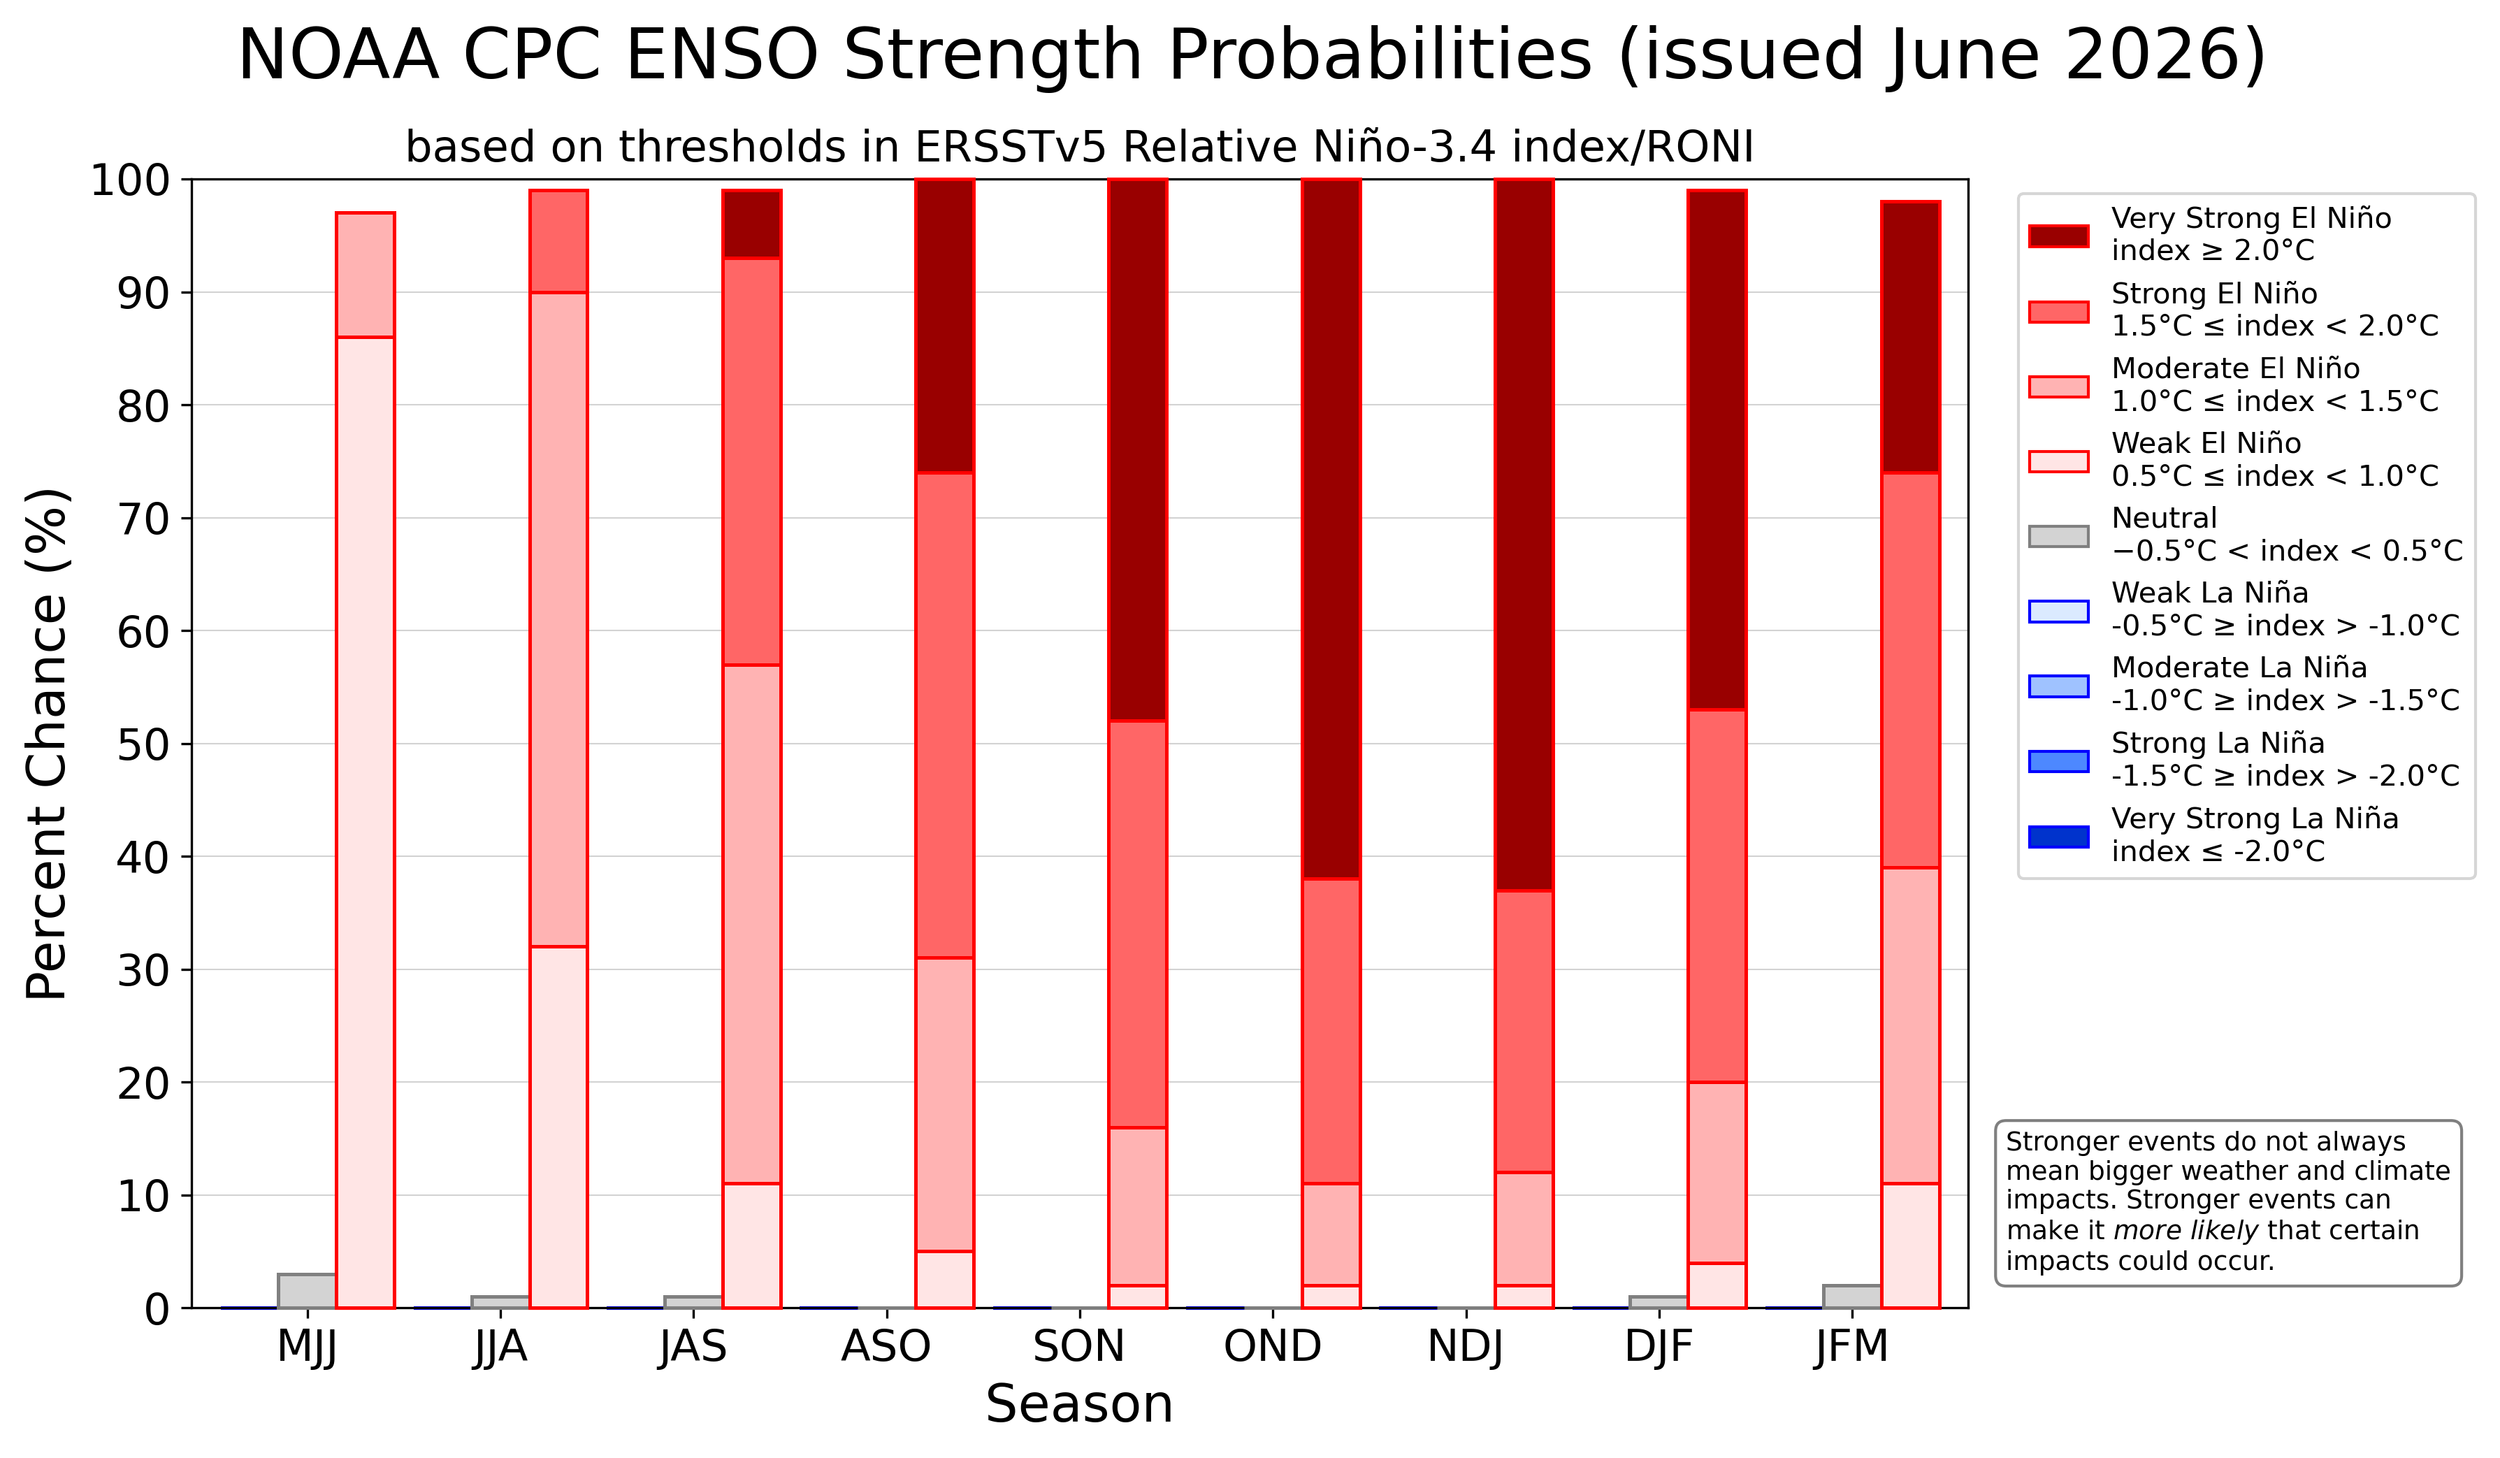
El Niño conditions are now present and are likely to continue into 2027. Since April 2026, sea surface temperatures in the Niño 3.4 region of the tropical Pacific have risen rapidly. The latest weekly Relative Niño-3.4 index value was +0.9°C as of June 15th, according to the NOAA CPC. The June NOAA CPC forecast indicates that El Niño will continue to strengthen over the coming months, and there is a 63% chance of a very strong event (Index ≥ 2.0°C) at its peak from November 2026 to January 2027 (Figure 1).
El Niño Climatic Impacts
El Niño events shift the odds toward wetter conditions in some regions and drier conditions in others, with the affected regions and seasons shown in Figure 2. El Niño events tend to enhance rainfall in Central Asia, southern North America, south-eastern South America, southern Europe, eastern and southern East Africa, and southern and eastern China. Drier-than-average conditions tend to occur in Central America, the Caribbean, northern South America, parts of western and northern East Africa, the Sahel region, Southern Africa, India, northern China, the Maritime Continent, and Australia. The stronger the El Niño event, the more likely the changes in precipitation patterns will resemble historical impacts.

Figure 2: Location and timing of likely above- and below-average precipitation related to El Niño events. Source: NOAA, CHC, FEWSNET

Figure 3: Global monthly average land-sea temperature anomalies in degrees Celsius relative to the 1991-2020 average. Monthly temperatures are colored according to the ENSO state, La Niña, Neutral, or El Niño, based upon the Relative Oceanic Niño Index (RONI). Source Data: NOAAGlobalTemp & NOAA Historical RONI values
El Niño events also tend to cause a temporary spike in global average surface temperatures. This occurs when warmer-than-average waters in the central and eastern Pacific Ocean release massive amounts of heat into the atmosphere. There is typically a delay between the onset of an El Niño event and the time at which global temperatures begin to be affected. The greatest influence on global averages often occurs in the months following the peak (typically November-January), keeping temperatures elevated well into the subsequent year. During the last El Niño, 2023-2024, global temperatures spiked to their hottest on record in 2024 due to a combination of long-term warming, El Niño, and other atmospheric influences. Numerous historical El Niño events have reliably coincided with the hottest years on record globally (Figure 3).
El Niño & Crop Yield Impacts
El Niño events have historically affected crop yields across every continent, though not always negatively. At the global level (Figure 4), rice yields tend to be about 1.0 to 1.5 percent below trend; wheat yields tend to be normal to slightly below normal; maize yields tend to be near trend, as negative impacts in one region are typically offset by positive impacts in another; and soybean yields tend to be roughly 1.5 to 2.0 percent above trend.
The remote effects of El Niño teleconnections vary from one event to the next. Part of this variability comes from the events themselves: El Niño events differ in strength, in the location of the warmest waters along the equatorial Pacific, and in how they evolve through the seasons, and these differences shape regional impacts (Capotondi et al., 2015). Part comes from the atmosphere that carries El Niño's influence on remote regions: the same event can produce different impacts depending on the background atmospheric state and on other climate patterns, such as the Indian Ocean Dipole.

Figure 4: Global-scale yield anomalies relative to expected yields during past El Niño events. Boxplots show the interquartile range and median of the yield anomalies, with the mean denoted by a white square. The size of each point corresponds to the strength of El Niño during Oct-Dec of that year. Source Data: FAOSTAT data and NOAA CPC Relative Oceanic Niño Index data.
Regionally (Figure 5), yield impacts can vary between crops, depending on their growing season and unique production constraints, and even within countries. Additionally, small-scale crop producers without access to irrigation are more vulnerable to El Niño's drying influences. Above-normal temperatures can compound these effects, increasing crop water demand and heat stress during critical growth stages. For maize, yields tend to see positive impacts in Central Asia, bimodal regions of East Africa, southern South America, and the US, while yields tend to see negative impacts in northern Brazil, India, Southern Africa, and northern Ethiopia. For soybeans, yields tend to see positive impacts in southern South America and the US, while yields tend to see negative impacts in India and Southern Africa. For wheat, yields tend to see positive impacts in Central Asia, Iran, East Africa, and the US, while yields tend to see negative impacts in Australia, Morocco, and southern South America. For rice, yields tend to see positive impacts in Iraq and Turkmenistan, while yields tend to see negative impacts in India and Mozambique.
The region of greatest concern is Southern Africa, where the main maize season (planting October–December 2026, harvest April–June 2027) coincides with the forecast peak of the El Niño event. During the 1997/98 and 2015/16 strong El Niño events, maize yields fell roughly 20 percent below trend in South Africa and up to 40 percent below trend in Zimbabwe. Drier-than-average conditions are also more likely across India during the June–September 2026 monsoon, in northern and western East Africa during June to September, in Central America and the Caribbean during the Primera season (May-September 2026) and the Segunda/Postrera season (August 2026–January 2027), and in the Maritime Continent, where reduced rainfall has historically delayed wet-season rice planting. Australian winter wheat is in the ground now and will be harvested as the event intensifies; impacts there have not scaled with event strength, and the last two strong events produced near-normal yields. Above-average rainfall is favored in some producing regions, including south-eastern South America, where wetter conditions have historically benefited soybean yields, and eastern East Africa during the October–December short rains, where beneficial precipitation for crops can be accompanied by negative impacts of flooding. Two caveats apply to all of these expectations. El Niño events differ among themselves in strength, structure, and timing, and no individual event exactly reproduces the historical composite (Capotondi et al., 2015).
Stronger El Niño events do lead to more predictable, though usually not more severe, crop yield outcomes, while weaker events lead to greater variability in yield outcomes. Notably, strong El Niño events, such as those in 1997 and 2015, resulted in maize and rice yield deficits of about 0 to 3% below trend in India. For wheat yields in Australia, yields during moderate intensity events have been about -20% below trend, although during the last two strong El Niño events, wheat yields were near-normal in Australia.

Figure 5: Subnational yield anomalies across the larger producing season in bimodal areas, as determined by production values in the 2000-2020 period, relative to expected yields during past El Niño events. El Niño events are identified based on the value of the Relative Oceanic Niño Index in Oct-Dec.
Conclusions
After a rapid rise in sea surface temperatures over the past few months, El Niño has emerged and will continue gaining strength over the coming months. At its traditional November-January peak, NOAA CPC estimates a 63% chance the event will be very strong (Index ≥ 2.0°C). Stronger events produce more predictable impacts on crop yields, so the historical record offers useful guidance for the coming twelve months. At the global scale, past El Niño events have shifted global yields of the major crops by only one to two percent. The principal risks are regional, and heightened monitoring is advised over these areas of concern.
Regionally, the areas of greatest concern for negative impacts on crop yields are Southern Africa, Central America, India, and Australia. Central Asia, southern East Africa, southern South America, and the US are likely to see the most positive impacts on crop yields, based on available historical yield data. There are also concerns in parts of Ethiopia and other areas where El Niño’s drying influences can negatively impact yields, especially for rainfed and subsistence farmers. Given the strong to very strong forecast El Niño conditions in 2026-2027, and the unique characteristics of individual events, crop and weather conditions in El Niño teleconnection regions should be carefully monitored using seasonal and subseasonal forecasts and observed agroclimatic data. Over the coming months, as the El Niño event progresses, additional reports will be released with more in-depth regional focuses.
References and Data Sources:
Australian Bureau of Meteorology (BoM) Southern Hemisphere Monitoring
NOAA El Niño/Southern Oscillation (ENSO) Diagnostic Discussion
NOAA Merged Land Ocean Global Surface Temperature Analysis (NOAAGlobalTemp)
NOAA Relative Oceanic Niño Index (RONI): Historical El Niño / La Niña episodes (1950–Present)
Capotondi, A., Wittenberg, A. T., Newman, M., Di Lorenzo, E., Yu, J.-Y., Braconnot, P., et al. (2015). Understanding ENSO diversity. Bulletin of the American Meteorological Society, 96(6), 921–938. https://doi.org/10.1175/BAMS-D-13-00117.1
Prepared in Collaboration with:
Disclaimer: The Crop Monitor special report is produced by GEOGLAM with inputs from the following partners (in alphabetical order): Amazon AWS, Climate Hazards Center UCSB, CGIAR Climate Action, European Commission, Harvard University, NASA Harvest, HarvestStat, Microsoft AI for Good Lab, SEI, and the University of Maryland. The findings and conclusions in this joint multi-agency report are consensual statements from the GEOGLAM experts and do not necessarily reflect those of the individual agencies represented by these experts. GEOGLAM accepts no responsibility for any application, use, or interpretation of the information contained in this report and disclaims all liability for direct, indirect, or consequential damages resulting from the use of this report.